

The most dangerous myth in trading is that you need to be right all the time. Novice traders obsess over win rates, believing that a 90% accuracy rating is the only path to profit. Veteran traders know better. They understand that trading isn’t about how often you win; it’s about how much you win when you’re right versus how much you lose when you’re wrong.
This brings us to the “Kissing Frogs” concept. In the fairy tale, you have to kiss a lot of frogs before one turns into a prince. In confluence trading, you might endure several small manageable losses, the frogs, before your strategy aligns perfectly to catch a massive runner, the prince.
Understanding the ratio of average win value to average loss value is what separates struggling traders from profitable ones. Here is why embracing those small losses is actually part of a winning strategy.
The Mathematics of “Kissing Frogs”
When we talk about “Kissing Frogs,” we aren’t talking about gambling or taking random stabs at the market. We are discussing a disciplined approach to Confluence Trading. This strategy relies on multiple technical indicators aligning to signal a high-probability trade. However, markets are noisy. Sometimes, indicators align, you enter the trade, and the market immediately chops sideways or reverses.
This is where risk management becomes your best friend.
The Win/Loss Value Ratio
Your average win value divided by your average loss value creates a ratio that dictates your long-term success.
Imagine two traders:
- Trader A wins 70% of the time. They make $100 on wins but lose $300 on losses. Over 10 trades, they win $700 and lose $900. Net result: -$200.
- Trader B (The “Frog Kisser”) wins only 40% of the time. They lose $50 on “frogs” but make $400 when they catch a “runner.” Over 10 trades, they lose $300 (6 losses) but make $1,600 (4 wins). Net result: +$1,300.
Trader B kisses a lot of frogs. They take small hits frequently. But their strategy is designed to cut those losses instantly when the confluence breaks, while letting the winners run significantly.
How Confluence Filters the Noise
A robust confluence strategy acts as your filter. It prevents you from kissing every frog in the pond. You only take trades where specific criteria are met, perhaps volume spikes, momentum shifts, and key support levels holding simultaneously.
Even with strict criteria, false starts happen. A “frog” trade typically looks like this:
- Entry: Confluence signals align. You enter the trade.
- Strict Trade Management strategy: Adjusting Stop to initially reduce risk and then make “risk free” and ultimately lock in profit
- Exit: Your aggressive trade management takes you out at a small loss or breakeven.
The loss is small because you didn’t hope or pray for a turnaround. You accepted that this frog was just a frog.
In the chart below we see two trades on the same instrument, both with late entries dues to confluence building slowly. The trade on the left was a average win size, with entry at the blue arrow and exit at the red arrow and the green vertical rectangle depicting win size. The trade on the right had an entry at the blue arrow and just started to print the trailing stop reducing risk and the trade as taken out with a small loss depicted by a red arrow in the exploded view. The red vertical box was the loss size. The comparison of the Average Win Size to Average Loss Size in the middle shows how this is one of the most important ratio’s in a tradrs strategy testing.

Catching the Runner: When the Prince Arrives
The payoff for patience and discipline is the “runner.” This is the trade where the confluence signal works exactly as intended. The price breaks out, momentum builds, and you are positioned perfectly to ride the trend.
This is where the psychology of trading becomes critical. It is easy to take a small loss, but it is incredibly difficult to hold onto a winning trade. The urge to “bank the profit” early is overwhelming, especially after you have just kissed three frogs in a row.
However, to make the math work, you must let the runner run. Your single large win needs to pay for the three small losses and still leave you with a healthy profit. If you cut your winners short, you destroy the risk-to-reward ratio that makes this strategy viable.
For a deeper dive into the mental fortitude required for this, read our guide on Letting Runners Run in Futures Trading: Mastering the Psychology and Process. It breaks down exactly how to manage your mindset when you are in a profitable position.
Visualizing the Strategy
To truly understand this dynamic, you need to see it on a chart.
(Note: Refer to the large runner chart images below. Compare the vertical distance of the “profit run” to the tiny dips of the previous losses. The reward (profit) for this trade was 500% x the risk. The inserted time line is an exploded view of the confluences building up over a 6 minute period as this trade setup.)
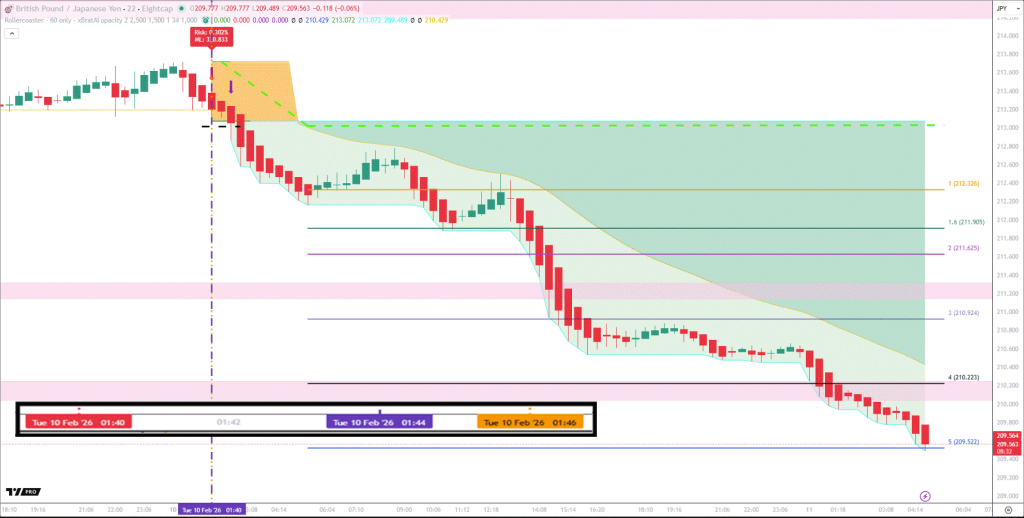
When you look at a chart of a successful “Kissing Frogs” session, it shouldn’t look like a straight line up. It should look like small, controlled steps back, followed by a massive leap forward. The small losses are just the cost of doing business, the admission fee you pay to be in the market when the big move happens.
Conclusion: Love the Frogs
You cannot have the runners without the frogs. They are a package deal. If you try to avoid losses entirely, you will hesitate when the perfect setup arrives, or you will hold onto losing trades hoping they turn around, turning a small “frog” into a monster that destroys your account.
- Accept the small losses: They are data, not failures.
- Trust the confluence: Wait for the stars to align.
- Let them run: When you catch the move, stay in the saddle.
Trading is a game of averages. By keeping your average loss tiny and your average win large, you tilt the mathematical probability in your favor. So go ahead, kiss the frogs. The prince is waiting just a few trades away.


